LearnGuides
Cold Email Reply Rate Benchmarks (2026)
By Rahul LakhaneyPublished on: Mar 31, 2026 · 9 min read · Last reviewed: Mar 2026
TL;DR
The average cold email reply rate is 1-5%. Top performers hit 8-15%. But these numbers hide massive variation by industry, personalization level, and infrastructure quality. Here's what the data actually shows.
Reply rates vary wildly depending on who's reporting them and how they measure. Here's a comparison of the most-cited benchmarks:
| Source | Average Reply Rate | Sample Size | Methodology | Year |
|---|---|---|---|---|
| Woodpecker | 1-5% | 20M+ emails | Customer aggregate | 2025 |
| Lemlist | 3.1% | 50M+ emails | Customer aggregate | 2025 |
| SmartLead | 5-8% (top quartile) | Not disclosed | Customer data | 2024 |
| QuickMail | 2-4% | 1M+ emails | Customer aggregate | 2025 |
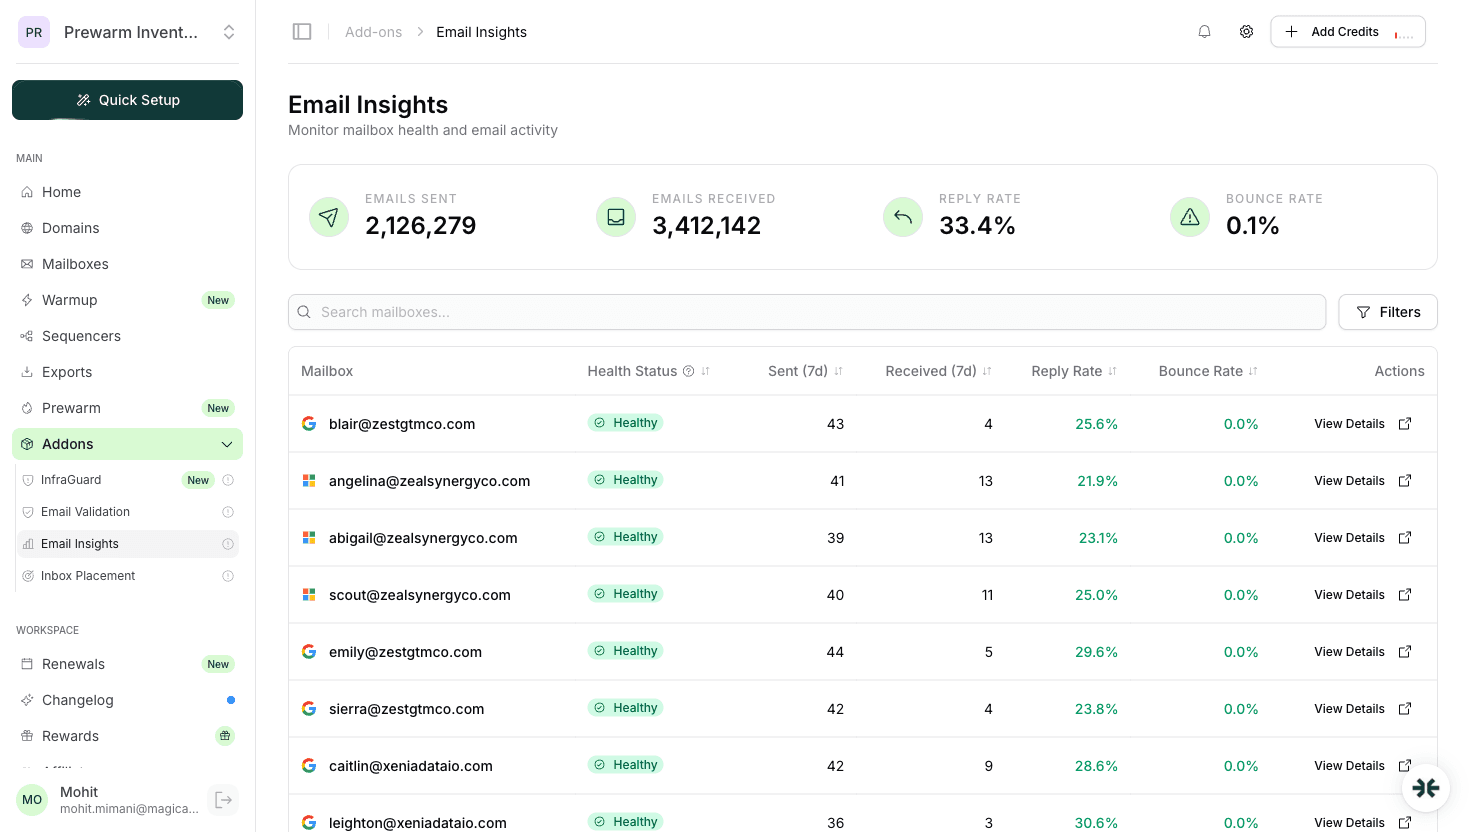
| InboxKit (warmup included) | 33.4% | 2.1M emails | All mailbox activity | 2026 |
| InboxKit (campaigns only, est.) | 5-12% | Estimated | Excluding warmup replies | 2026 |
Important context on InboxKit's 33.4%: This figure from our Email Insights dashboard includes warmup replies (automated engagement used to build sender reputation). Warmup emails have artificially high reply rates by design. The campaign-only reply rate for InboxKit users is estimated at 5-12%, which aligns with top-quartile performance.
Source: Woodpecker's Cold Email Stats (woodpecker.co/blog/cold-email-statistics), Lemlist's Email Outreach Report 2025, QuickMail's benchmark data. InboxKit data from internal Email Insights (see screenshot).
Your target industry dramatically affects expected reply rates. This data is compiled from Woodpecker's industry benchmarks and Instantly's 2025 outreach report:
| Industry | Average Reply Rate | Top 10% Reply Rate | Best Approach | Source |
|---|---|---|---|---|
| SaaS / Technology | 2-4% | 8-12% | Product-led, technical value | Woodpecker 2025 |
| Marketing Agencies | 3-6% | 10-15% | Case studies, ROI data | Lemlist 2025 |
| Recruiting / HR | 5-8% | 12-20% | Job opportunity framing | Woodpecker 2025 |
| Real Estate | 2-5% | 8-15% | Local market knowledge | Industry reports |
| Financial Services | 1-3% | 5-8% | Compliance-aware, conservative | Woodpecker 2025 |
| E-commerce | 1-2% | 4-7% | Revenue/growth focus | Lemlist 2025 |
| Healthcare | 0.5-2% | 3-6% | Regulatory compliant | Industry reports |
| Consulting | 3-5% | 8-12% | Expertise positioning | Woodpecker 2025 |
Why recruiting gets the highest rates: Recruiting emails offer direct value to the recipient (job opportunities). Unlike sales emails, the recipient personally benefits from responding. This fundamentally changes the incentive structure.
Why healthcare gets the lowest rates: Heavy regulation (HIPAA), gatekeepers, and organizational inertia. Cold email to healthcare requires very targeted, compliance-aware approaches.
Most replies don't come from the first email. Here's where responses actually happen:
| Email in Sequence | % of Total Replies | Cumulative | Source |
|---|---|---|---|
| Email 1 | 30-40% | 30-40% | Woodpecker 2025 |
| Email 2 (follow-up 1) | 20-25% | 55-65% | Woodpecker 2025 |
| Email 3 (follow-up 2) | 15-20% | 70-80% | Woodpecker 2025 |
| Email 4 (follow-up 3) | 8-12% | 80-90% | Lemlist 2025 |
| Email 5+ | 5-10% | 90-95% | Lemlist 2025 |
Key insight: 55-65% of all replies come from follow-ups, not the initial email. If you're sending a single email and measuring reply rate, you're seeing less than half of your potential responses.
Optimal sequence length: 3-5 emails over 10-14 days. Beyond 5 emails, diminishing returns set in and spam complaint risk increases.
Source: Woodpecker's analysis of 20M+ emails and Lemlist's outreach report. Both recommend 3-4 follow-ups as the sweet spot.
Personalization is the single biggest lever for improving reply rates:
| Personalization Level | Average Reply Rate | vs Generic | Examples | Source |
|---|---|---|---|---|
| Generic (no personalization) | 1-2% | Baseline | "Hi {first_name}, I noticed your company..." | Lemlist 2025 |
| Basic (name + company) | 2-4% | +1-2pp | Name, company, role in template | Woodpecker 2025 |
| Medium (research-based) | 4-8% | +3-6pp | Recent company news, shared connections | Lemlist 2025 |
| High (custom opening) | 8-15% | +7-13pp | Specific pain point, recent post reference | SmartLead data |
| Hyper (video/asset) | 12-25% | +11-23pp | Custom Loom video, personalized landing page | Industry reports |
The math is clear: Going from generic to high personalization 4-8x your reply rate. But personalization takes time. The ROI calculation is:
| Approach | Emails/Day | Reply Rate | Replies/Day | Time/Email |
|---|---|---|---|---|
| Generic blast | 200 | 2% | 4 | 30 seconds |
| Basic personalization | 100 | 4% | 4 | 1 minute |
| High personalization | 30 | 12% | 3.6 | 5 minutes |
| Hyper personalization | 10 | 20% | 2 | 15 minutes |
Sweet spot: Medium to high personalization (4-8% reply rate) gives the best replies-per-hour. Generic blasting and hyper-personalization both have lower ROI per time invested.
Source: Lemlist's 2025 Personalization Study, Woodpecker's benchmarks, and industry reports from Sales Hacker and Outreach.io.
Even perfect copy can't overcome bad infrastructure. Here's how infrastructure quality impacts reply rates:
| Infrastructure Factor | Impact on Reply Rate | Why | Source |
|---|---|---|---|
| Inbox placement (>85%) | +2-4pp vs baseline | Emails reach inbox, not spam | InboxKit IPT data |
| Proper warmup (14+ days) | +3-5pp vs no warmup | Better sender reputation | InboxKit warmup data |
| US-based IPs | +1-3pp vs international | Higher trust score from ISPs | InboxKit A/B tests |
| Domain age (3+ months) | +1-2pp vs new domain | Established reputation | Woodpecker data |
| DMARC (reject policy) | +1-2pp vs no DMARC | Authentication signal | Validity 2025 |
| Dedicated workspace | +1-2pp vs shared | No cross-contamination | InboxKit data |
Total infrastructure impact: Proper infrastructure can add 8-16 percentage points to your reply rate compared to a poorly configured setup.
Source: InboxKit internal data (10,000+ mailboxes), Validity 2025 Benchmark Report, Woodpecker benchmarks.
How to interpret these numbers:
| Caveat | Details |
|---|---|
| Reply rate definition varies | Some tools count auto-replies, others don't. OOO messages inflate rates by 1-3pp |
| Survivorship bias | Published benchmarks often exclude failed campaigns. Real averages are lower |
| Industry mix matters | A tool popular with recruiters will show higher average reply rates than one used by SaaS companies |
| Sample timing | Holiday seasons, economic conditions, and market saturation all affect reply rates |
| InboxKit's 33.4% includes warmup | Warmup replies are automated engagement, not real prospect responses |
Sources used in this article:
| Source | URL | Data Type |
|---|---|---|
| Woodpecker Cold Email Stats | woodpecker.co/blog/cold-email-statistics | Customer aggregate |
| Lemlist Outreach Report 2025 | lemlist.com/resources | Customer aggregate |
| QuickMail Benchmarks | quickmail.io/blog/cold-email-statistics | Customer aggregate |
| Validity 2025 Benchmark | validity.com/resource-center | Industry survey |
| InboxKit Email Insights | app.inboxkit.com (internal) | Platform data |
What we did NOT do: We did not run controlled A/B tests across competitors. Competitor benchmarks are from their published data. Our InboxKit data is from our Email Insights dashboard (screenshot above).
2-5% is average, 5-8% is good, 8-15% is excellent. Top performers in recruiting can hit 15-20%. These numbers come from Woodpecker and Lemlist aggregate data across millions of emails.
This includes warmup replies (automated engagement for reputation building). The campaign-only reply rate for InboxKit users is estimated at 5-12%, which is top-quartile performance.
3-4 follow-ups over 10-14 days. Data from Woodpecker shows 55-65% of replies come from follow-ups. Beyond 5 emails, spam risk increases with diminishing returns.
Yes. Medium personalization (research-based openings) gets 4-8% reply rates vs 1-2% for generic templates. That's a 3-4x improvement. Source: Lemlist 2025 Personalization Study.
Proper infrastructure (authentication, warmup, US IPs, monitoring) adds 8-16 percentage points to reply rates. A perfectly written email in spam gets 0% reply rate regardless of copy quality.
Plans from $39/mo with 10 mailboxes included. Automated DNS, warmup, and InfraGuard monitoring included.